

CBU/CAR's latest map for leading automakers in China is available for purchase now!! And we are taking orders now, each set will be at the price of RMB1500, plus RMB100 for domestic shipping, or RMB330 for international shipping.
Our map contains detailed information as followed:
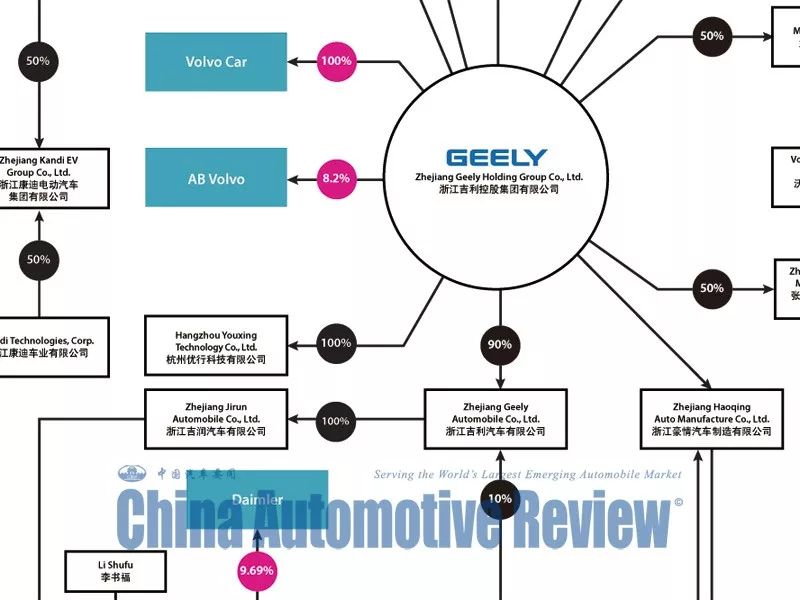
1. Percentages in the tree diagram display the share proportion held by the upper-level enterprise, while the level is divided by automotive groups, affiliated automotive companies and brands.
2. The charts show the passenger vehicles annual sales volume trend and mega cities with cars population over 2 millon.
3. Numbers in red in the map stand for passenger vehicles registration in each province in 2017 (thousand units).
4. In the map, the darker color mean the higher auto output in the province, vice versa.
The data related to this map will be updated constantly, and make sure our customers always have first-hand information regarding the Chinese auto industry.
If you are interested in buying, please click "Read More" to log onto our official website for online order. We'll be glad to answer any of your questions.
中国汽车要闻全新的2018版中国主流车企在华布局图(英文版)终于更新完毕!从今日起开始对外接受订购,支持国内外订购。仅售人民币1500元,国内邮费100元,海外邮费330元。
2018版中国主流车企布局图(英文版)详细列出了目前国内各大汽车集团的整车生产、竞争关系、区域分布等内容,并将各省、市、行政区的整车分布情况逐一列出。
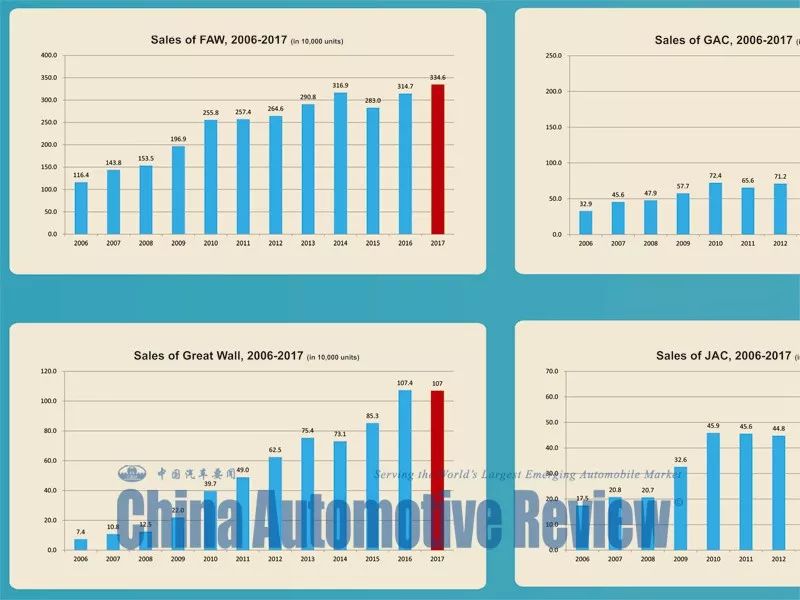
图中包括分支机构的股比及中英文名称、主流主机厂产能分布、截至2017年乘用车上牌量热度分布、以及主流主机厂年度销量。我们将根据数据变化定期对地图进行更新。保证客户随时获得一手资讯。
有兴趣上手的各位看官,可点击“阅读原文”进入我们的官网填写订购表格。如有任何问题,请随时联系我们!
©本刊所有图片、文字及版式版权均为【中国汽车要闻】(China Business Update)所有,未经授权许可,不得复制或用作其它商业用途,其他网站及平面媒体如需转载,须注明作者及出处。


 )
)